Dynamic Dashboards
Real-time insights for travel demand modeling, crash analysis, and transportation data visualization. Our dashboards serve as the nerve center for your planning efforts.
Real-Time Window Into Your Data
Our dynamic dashboards give you a live, up-to-the-minute view of your transportation data. As real-time data streams in — shifts in travel patterns, traffic congestion, and demand drivers — you can respond immediately and adjust your strategies on the fly.
We design every dashboard to turn complex datasets into clear, actionable visuals. Whether you are tracking travel demand model outputs or analyzing crash severity across a corridor, the result is the same: confident, data-driven decisions without digging through spreadsheets.
Dashboard Capabilities
From adaptive demand modeling to comprehensive crash analysis and real-time visualization.
Travel Demand Modeling
Real-time dashboards that serve as the nerve center for your travel demand modeling efforts, allowing you to respond promptly to changing scenarios and adjust results to optimize your transportation network.
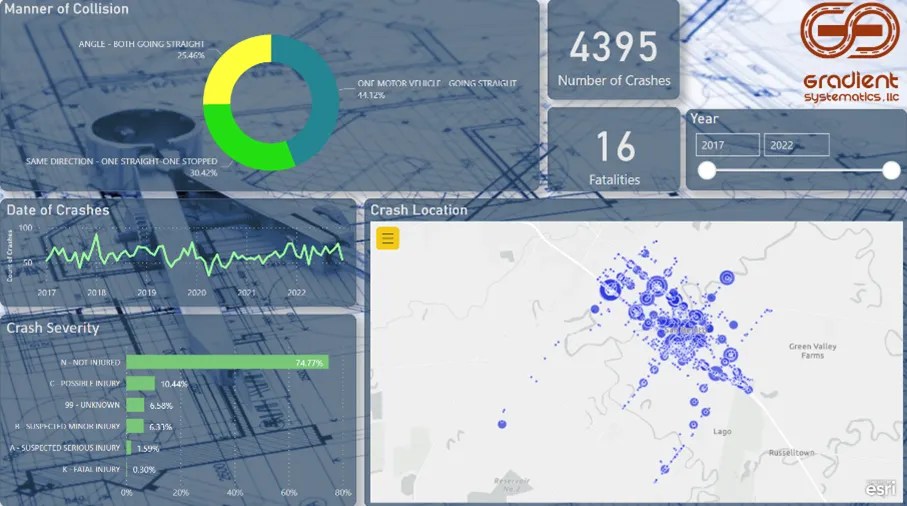
Crash Analysis
In-depth dashboards that provide a comprehensive view of each crash within a designated area, analyzing crash severity, manner of collision, and fatality data to support targeted safety measures.
Real-Time Data Integration
Live data streams that provide up-to-the-minute insights into shifts in travel patterns, traffic congestion, and the impact of various factors on demand.
Data Visualization
We transform complex data into vivid, easily digestible visual representations, giving you not just access to information but clarity for confident decision-making.
Ready to Transform Your Data?
Tell us about your project and we'll build a dynamic dashboard tailored to your needs.