Data Analysis and Visualization

Welcome to Gradient Systematics, your trusted partner in transforming the landscape of transportation engineering and planning through the power of data analytics and machine learning. In today’s data-rich environment, where everything from vehicles, sensors, cameras, and more serves as a potential data source, we leverage technology to extract valuable insights and craft compelling narratives that are accessible to non-technical audiences.

Our comprehensive suite of cutting-edge technologies is designed to equip you with the tools needed to achieve exceptional levels of efficiency, precision, and sustainability across all facets of your transportation projects. By harnessing the capabilities of data analytics and machine learning, we offer a dynamic approach to decision-making that’s fueled by data-driven insights.

Our expertise in these fields allows us to provide tailored solutions that optimize traffic flow, enhance infrastructure design, and create smarter, more resilient transportation networks. We understand that the data landscape is vast and complex, but our technology simplifies it, enabling us to tell a meaningful story from the data and make insights visible to all stakeholders, regardless of their technical expertise.

At Gradient Systematics, we believe in the potential of technology to drive positive change in transportation. Our commitment to innovation, combined with over 25 years of experience and a successful track record of 100+ projects nationwide, positions us as the ideal partner to help you navigate the complexities of modern transportation challenges.

Together, let’s embark on a journey that not only revolutionizes the way we approach transportation engineering but also paves the way for a more sustainable and interconnected future. Welcome to a new era of transportation excellence with Gradient Systematics.

SERVICES

GIS

GIS, or Geographic Information Systems, is the backbone of location-based intelligence. It's a technology that captures, stores, analyzes, and visualizes spatial data, helping us make sense of the world around us. Whether it's urban planning, environmental management, or optimizing logistics, GIS plays a pivotal role in understanding the spatial relationships and patterns that drive decision-making. It's the key to unlocking insights and creating smart, data-driven solutions for a wide range of applications.
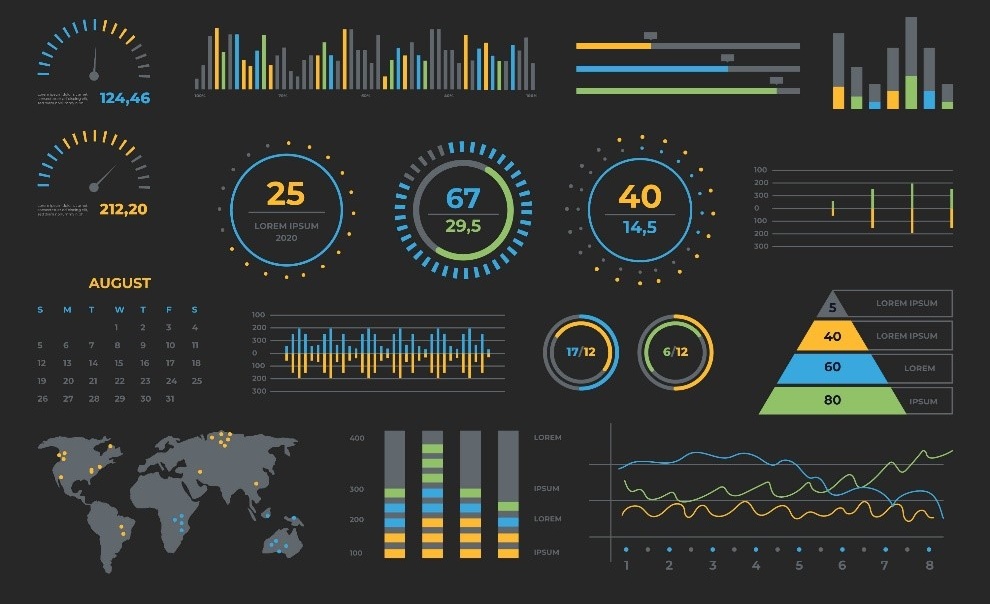
DYNAMIC DASHBOARDS

Dynamic dashboards and data visualization go hand in hand to provide real-time, actionable insights. These powerful tools transform complex data into visually engaging representations, allowing you to monitor, analyze, and respond to changing trends and conditions with ease. With dynamic dashboards, you can make informed decisions swiftly, fostering agility in your operations and unlocking the full potential of your data.

TRAFFIC MODELING VISUALIZATIONS

We excel in road network visualization using software like TransCAD, CUBE Voyager, and VISUM integrated with GIS tools, aiding clients in evaluating transportation improvements. Our 3D visualization simplifies complex traffic analysis for scenarios like intersection improvements and special events, facilitating informed decisions.

MACHINE LEARNING AND AI

Machine learning and AI are at the forefront of technology. Machine learning enables computers to learn and make predictions from data, while AI empowers machines to mimic human intelligence. Together, they drive innovation, automate tasks, and enhance decision-making across various industries.

TOOLS FOR DATA VISUALIZATION

EXCEL CHARTS

Simple and user-friendly for creating basic graphs and charts.

TABLEAU

Offers a range of interactive data visualization options and is widely used in the industry.

PBI LogoCreated with Sketch.

Power BI

In transportation planning, dashboards are created to visualize and manage transportation data.

PYTHON LIBRARIES

Matplotlib, Seaborn, and Plotly are popular options for creating custom visualizations.