

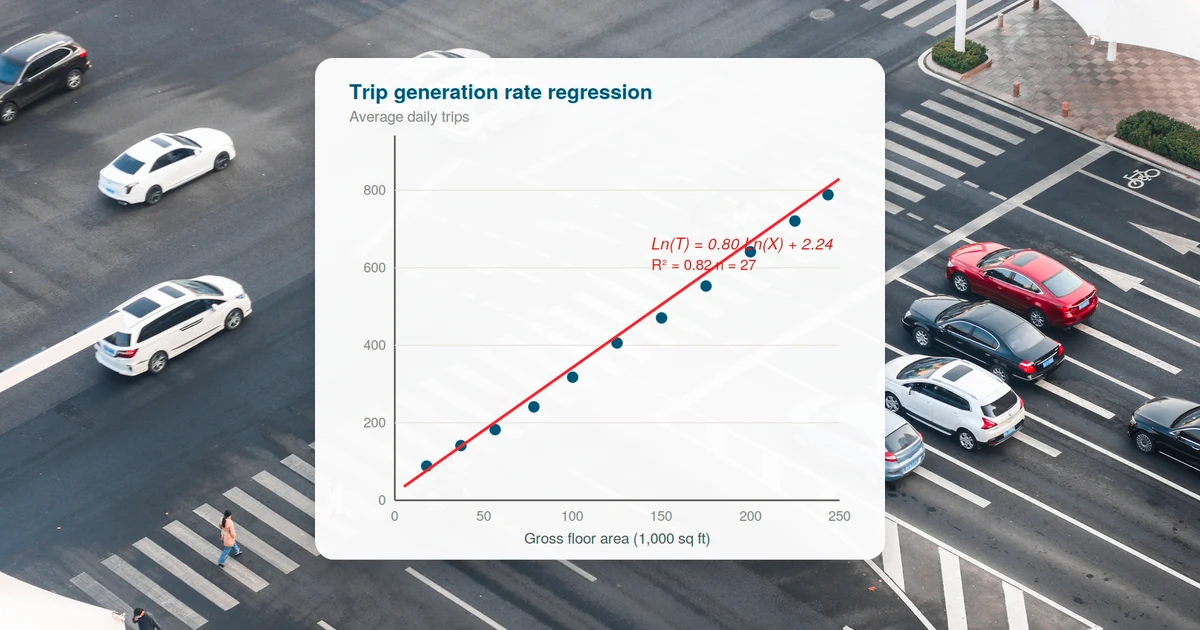
For most transportation engineers, the ITE Trip Generation Manual is muscle memory. Pull the land use code, find the average rate or regression equation, multiply by the development size, and move on to the next section of the traffic impact analysis (TIA). It's fast, it's defensible in the eyes of most reviewing agencies, and it's been the industry's common language for over 40 years.
But "defensible" and "accurate" are not the same thing. As land use patterns, travel behavior, and data availability have all shifted dramatically in the last decade, the gap between what the Manual predicts and what actually shows up on the ground has widened — and it's widening in ways that matter for revenue forecasts, capacity design, and mitigation costs.
Where the Standard Rates Start to Break Down
Thin and skewed sample sizes
Many land use codes are built on a handful of studies, some decades old, concentrated in a narrow set of regions. A single-family (LUC 210) or fast-casual restaurant (LUC 930/931/932) rate can look statistically clean while the underlying sample is dominated by suburban, auto-oriented sites that don't resemble an infill or transit-adjacent parcel in Dallas, Atlanta, or anywhere with a meaningfully different built environment.
Context blindness
The core average-rate methodology assumes a generalized suburban, single-use, free-parking, drive-alone environment. It doesn't natively account for walkability, transit access, on-street parking constraints, or mixed-use internal capture — all of which suppress vehicle trip generation, sometimes substantially. ITE's own guidance (NCHRP 684 and 770) acknowledges this, but the adjustments are inconsistently applied, and many agencies still expect raw Manual output as the baseline.
Temporal drift
Post-2020 travel behavior hasn't fully reverted to pre-pandemic patterns. E-commerce delivery trips, hybrid work schedules that flatten the peak hour, and changing retail visitation all mean older survey vintages can systematically over- or under-predict — and the direction of the error depends heavily on land use type.
Pass-by and internal capture assumptions
These reductions are frequently applied using generic percentages rather than site-specific analysis, which can materially swing net new trip estimates for retail and mixed-use sites — precisely the land uses most sensitive to these adjustments.
Toll and managed lane sensitivity
For revenue-critical facilities, generic trip rates say nothing about value-of-time distribution, diversion behavior, or induced demand — variables that dominate the actual traffic and revenue outcome far more than raw trip generation volume does.
What to Do Instead: A More Rigorous Toolkit
Ground-truth with local counts
Where feasible, supplement Manual rates with driveway or intersection counts at comparable local sites. Even a small independent sample can validate — or flag — whether the Manual rate is a reasonable fit for your specific context.
Use big data as a cross-check, not a replacement
Mobile location data platforms (StreetLight, Replica, and similar) can generate observed trip patterns for analogous sites at a fraction of the cost of a manual count program — especially valuable for validating internal capture and pass-by assumptions with actual origin-destination behavior rather than fixed percentage tables.
Apply NCHRP 684/770 methods deliberately, not as a checkbox
Calculate internal capture from the actual land use mix and proximity, and adjust for walk/bike/transit mode share using local mode-split data rather than default urban/suburban assumptions.
Favor regression equations over average rates
When sample size and R² support it, use the fitted equation and disclose the statistics. An average rate hides variance; a well-fitted equation with a reasonable independent variable (GFA, employees, dwelling units) reflects scale effects more honestly, particularly for larger developments.
Build in sensitivity testing
For revenue- or capacity-critical projects, run the analysis under a plausible range of assumptions (ITE average vs. local count vs. big-data-derived) and disclose the range. This matters most on toll and managed lane studies, where forecast uncertainty directly affects bond ratings and investment decisions.
Document every deviation
Reviewing agencies are far more receptive to a well-documented deviation from Manual defaults than to an unexplained one. A short methodology memo showing why and how a rate was adjusted — with data sources cited — turns a potential point of pushback into a credibility asset.
The Bottom Line
The ITE Trip Generation Manual isn't obsolete — it's a starting point, not a finish line. The firms and agencies producing the most defensible, most accurate forecasts are the ones treating it as one input among several: local counts, big data validation, context-sensitive multimodal adjustments, and transparent sensitivity analysis. That's where trip generation stops being a lookup exercise and starts being real engineering.
At Gradient Systematics, this layered approach is standard practice across our TIA, toll and managed lane, and revenue forecasting work — because the cost of getting trip generation wrong shows up years later, in congested intersections and underperforming revenue projections.
Want to go deeper?
Once your trip numbers are solid, the next question is scope. Read how big a traffic study area really should be — how those same trips define the boundary of the study.