DYNAMIC DASHBOARDS
Adaptive Travel Demand Modeling:
Imagine having a real-time window into your travel demand modeling process, where information flows seamlessly, updates are instantaneous, and insights are at your fingertips. Our dynamic dashboards serve as the nerve center for your travel demand modeling efforts. They allow you to respond promptly to changing scenarios and adjust the results accordingly, ensuring that your transportation network is optimized for current conditions.
With our dynamic dashboards, you gain access to a comprehensive and up-to-the-minute overview of your travel demand modeling outcomes. Real-time data streams in, providing you with insights into shifts in travel patterns, traffic congestion, and the impact of various factors on demand. This live feed of information equips you to make immediate adjustments to your transportation strategies, ensuring that they align with the dynamic nature of travel demand.
Comprehensive Crash Analysis:
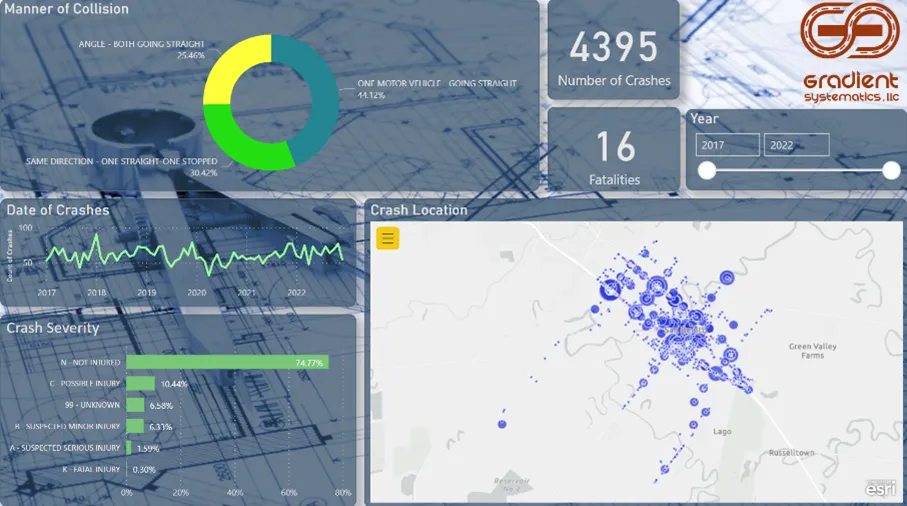
But our dynamic dashboards are not limited to demand modeling alone; they also excel in the realm of crash analysis. They provide an in-depth view of each crash within a designated area, offering a comprehensive understanding of the factors leading to incidents. This level of detail is invaluable for improving road safety and reducing accident rates.
Our crash analysis dashboard goes beyond simple incident reporting. It delves deep into the specifics of each crash, presenting a visual narrative of contributing factors such as crash severity, manner of collision, and fatality. This comprehensive analysis equips transportation authorities and law enforcement agencies with the insights needed to implement targeted safety measures and reduce the likelihood of future incidents.
In a world where every data point matters, the ability to access real-time insights and respond swiftly to changing conditions is transformative. It not only enhances your network’s efficiency but also contributes to a safer, more reliable, and demand-responsive transportation experience for all stakeholders.
With Gradient Systematics and our dynamic dashboards, you’re not just managing transportation networks; you’re orchestrating them with precision and adaptability. What truly sets us apart is our dedication to unparalleled data visualization. We transform complex data into vivid, easily digestible visual representations. This means that you don’t just have access to information; you have clarity, enabling you to make informed decisions confidently.


